Analytics

Understand traffic, journeys and media impact across your venues

From entrances to stores, from audiences to journeys, Digeiz turns video into actionable insights at every level of your asset.

Multi-dimensional intelligence

One platform, multiple levels of analysis.

Move from portfolio to mall, floor, area, store, point of interest and media screen — across traffic, audience, behavior and performance.
One data layer

Every colored signal can be read from the portfolio view down to a single screen or point of interest.
TrafficAudienceBehaviorPerformance
Analysis levelTTrafficAAudienceBBehaviorPPerformance
01Portfolio
02Mall
03Floor
04Area / Zone
05Store / POI
06Media / Screen
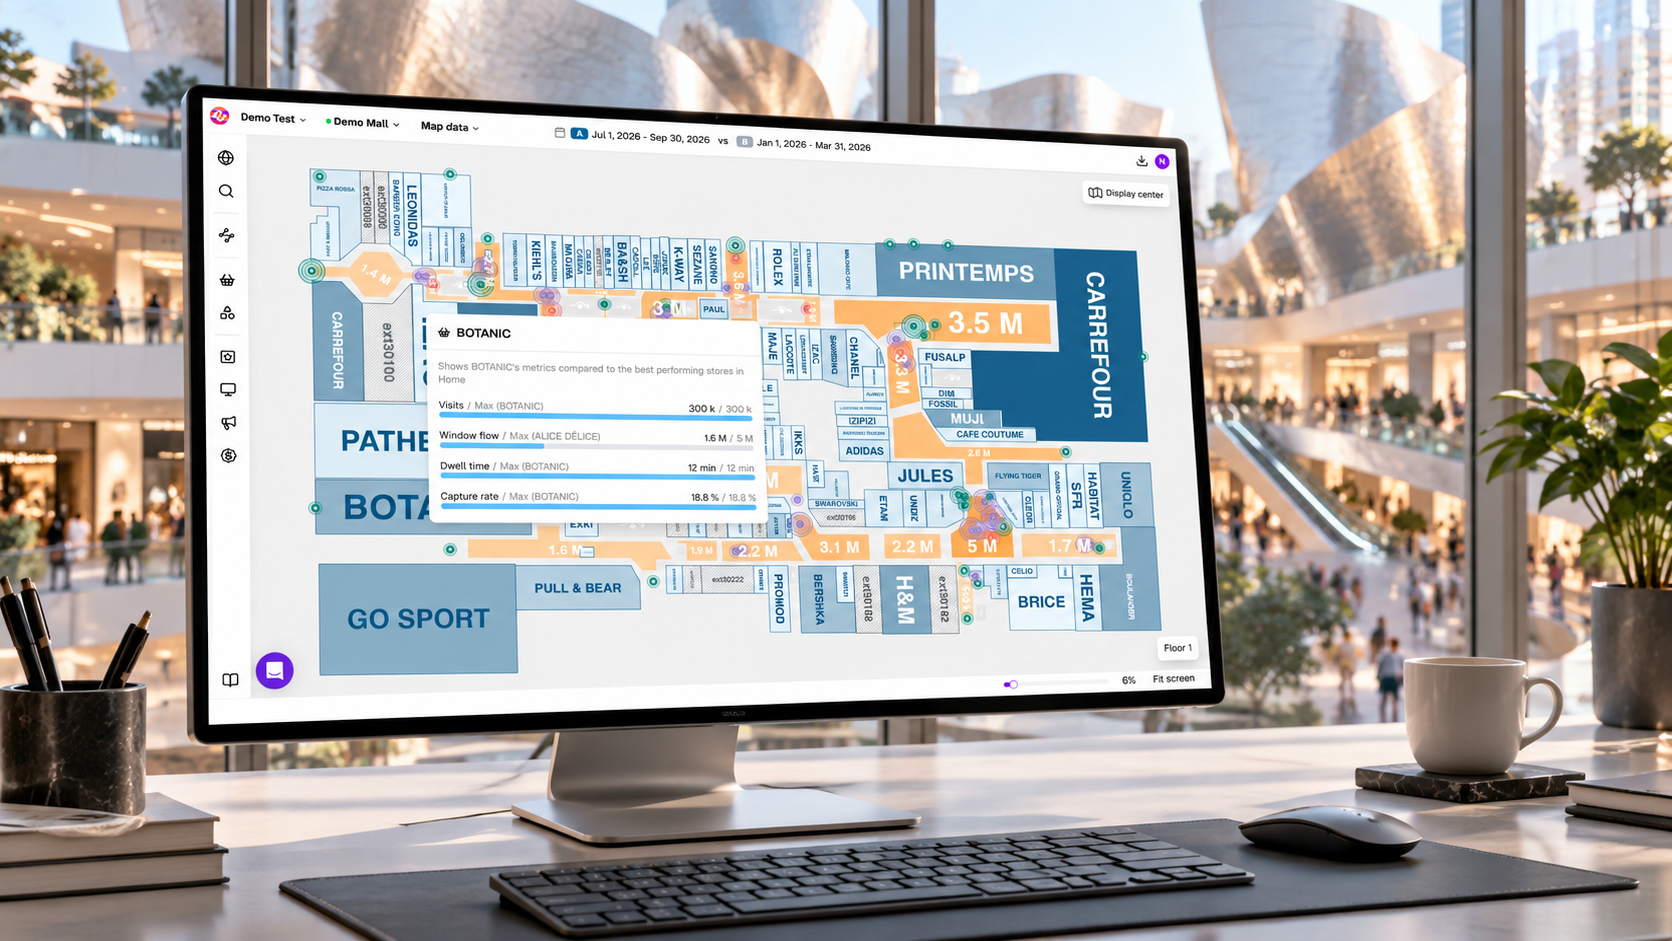
Digeiz dashboard displaying a mall floor plan with traffic signals and store-level performance data
Live mall intelligence

From a floor plan to the operational signals behind it.

From signal to decision

Spatial intelligence, ready for action.

Open one live interface to understand how a venue performs: traffic, journeys, dwell time and capture rate are visible at the scale of a portfolio, mall, floor, zone or store.
01

Read the venue

Bring floors, zones, stores and points of interest into one shared spatial view.

02

Compare performance

Move from visits and flows to dwell time and capture rate, in context.

03

Equip every team

Give asset, leasing and operations teams a common operational language.

Key differentiator

Retail media & campaign performance

Measure audience exposure, reach, frequency, repeat exposure and demographics — then connect them to incremental visits and destination impact.
01Exposure
02Visit
03Conversion

Comparison views use campaign-specific audited results only; no example figures are fabricated.

01

Footfall & traffic intelligence

Measure entries and exits, traffic distribution, peak hours and flows between areas.

Identify high-traffic zonesOptimize circulationTrack performance over time
02

Audience & visitor segmentation

Understand gender, age groups, group size and category-based audience segments.

Who your visitors areHow audiences differ by zoneWhich audiences drive performance
03

Dwell time & engagement

Compare average and median dwell time, time spent by zone or store and bounce rate.

Identify engagement zonesCompare store attractivenessDetect friction areas
Data activation

Access your data. Activate it everywhere.

Dashboards

Interactive views across all levels, custom views by team, real-time and historical analysis.

Automated reporting

Scheduled reports, custom recipients and continuous performance tracking.

APIs

Structured endpoints for footfall, journeys, dwell time and media performance.

Integrations

BI tools, CRM, DSP / SSP, internal tools and scalable data pipelines.

Talk to Digeiz

Turn analytics into better decisions and measurable impact